What are panels
Panels are visual elements that display the result of a database query in chart format. They are the building blocks of dashboards — you can add panels to a dashboard to create a complete data view.
Here is an example of a dashboard with a panel:
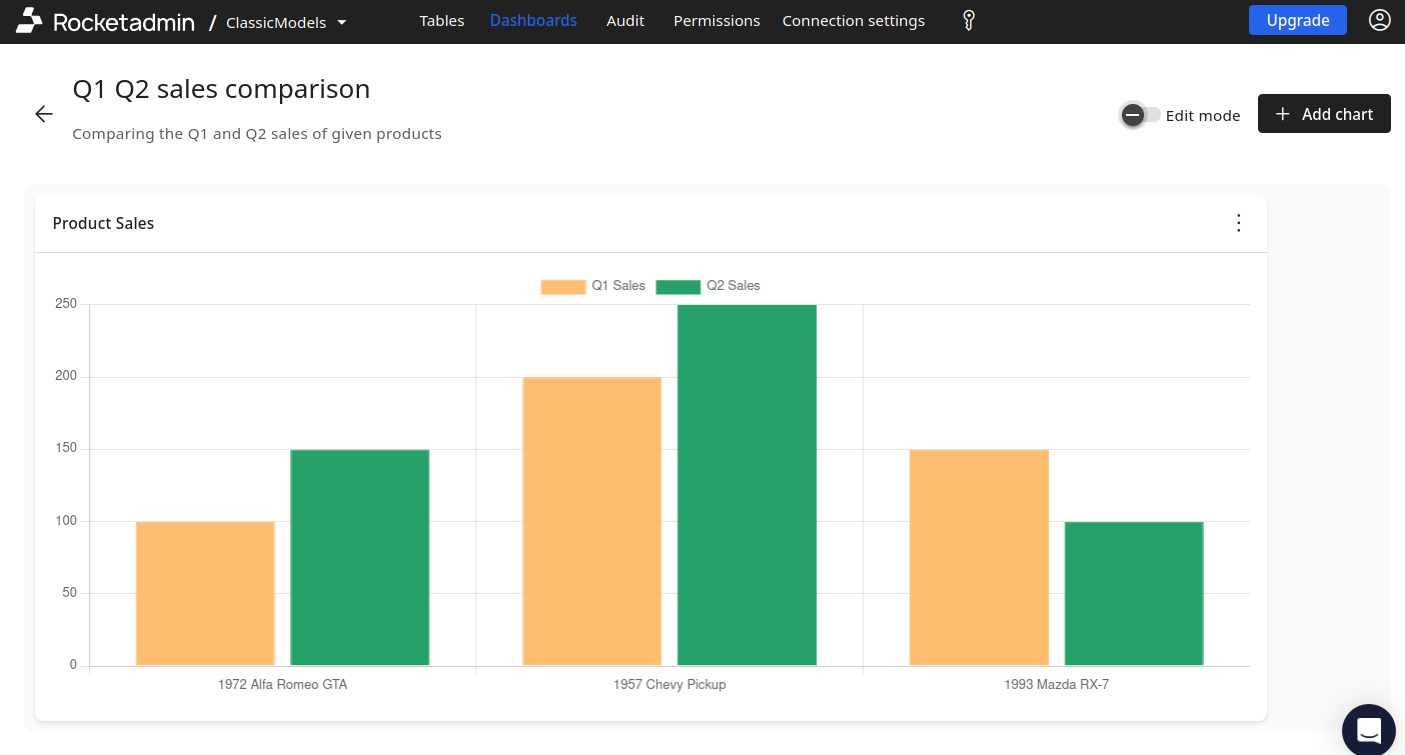
Panels are defined at the connection level, therefore a single panel can be reused across multiple dashboards. All panel queries are validated to be read-only — write operations are blocked.
Where to find panels
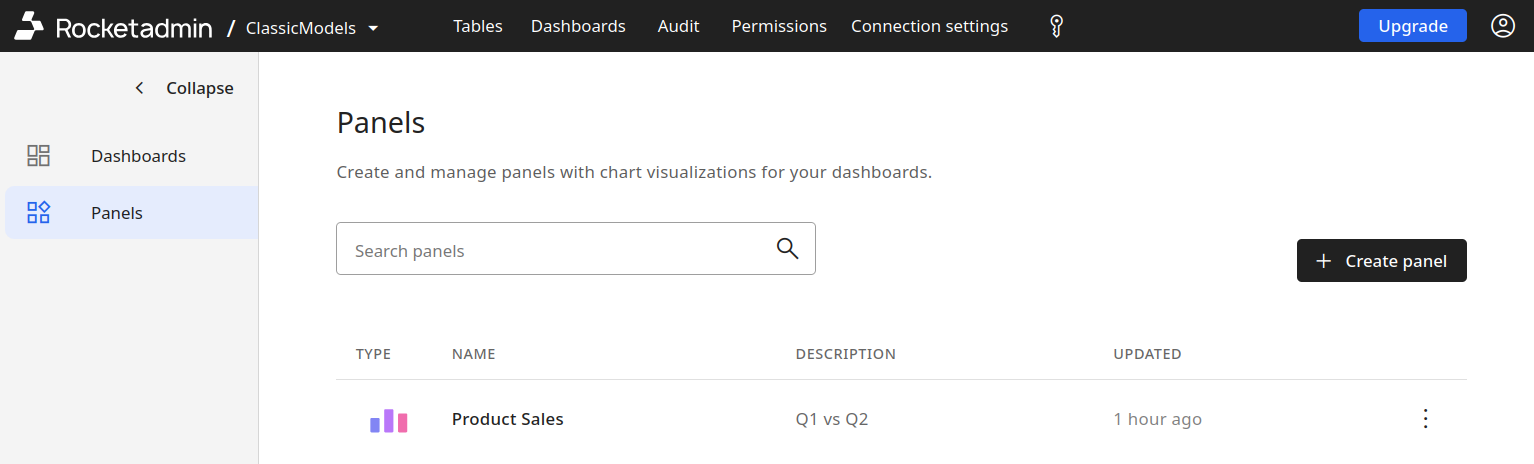
You can find them in the Panels section of the Dashboards menu.
Panel configuration
Generate with AI
We have incorporated an AI assistant designed to help you create panels based on the information from your database tables.
To demonstrate the AI assistant capabilities, we will use a MySQL sample database:
and create a panel to show the number of orders and total revenue generated each month.
Steps to follow:
-
From the Dashboards -> Panels screen, click the Create Panel button.
-
In the Create Panel screen, navigate to the Generate with AI section:
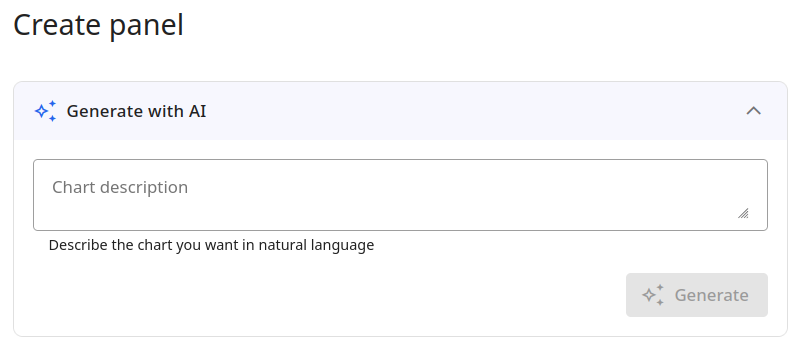
-
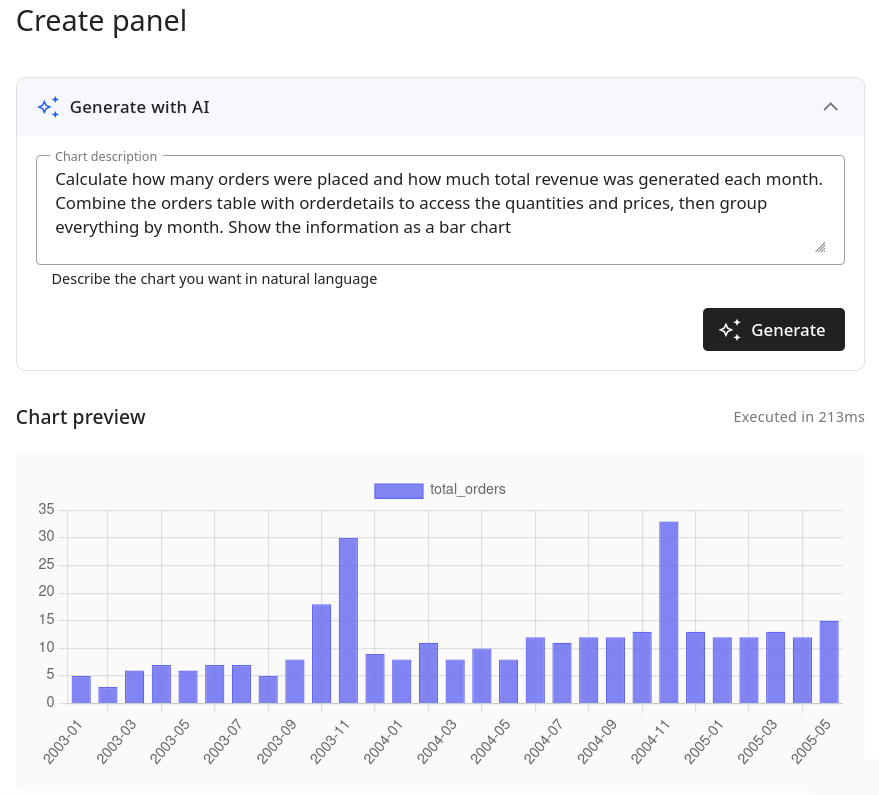
Enter a description (or prompt) for the chart you want to create.
For example:
Chart description - "Calculate how many orders were placed and how much total revenue was generated each month. Combine the orders table with orderdetails to access the quantities and prices, then group everything by month. Show the information as a bar chart."
-
Click the Generate button.
The AI assistant will generate the SQL query and display the chart preview:
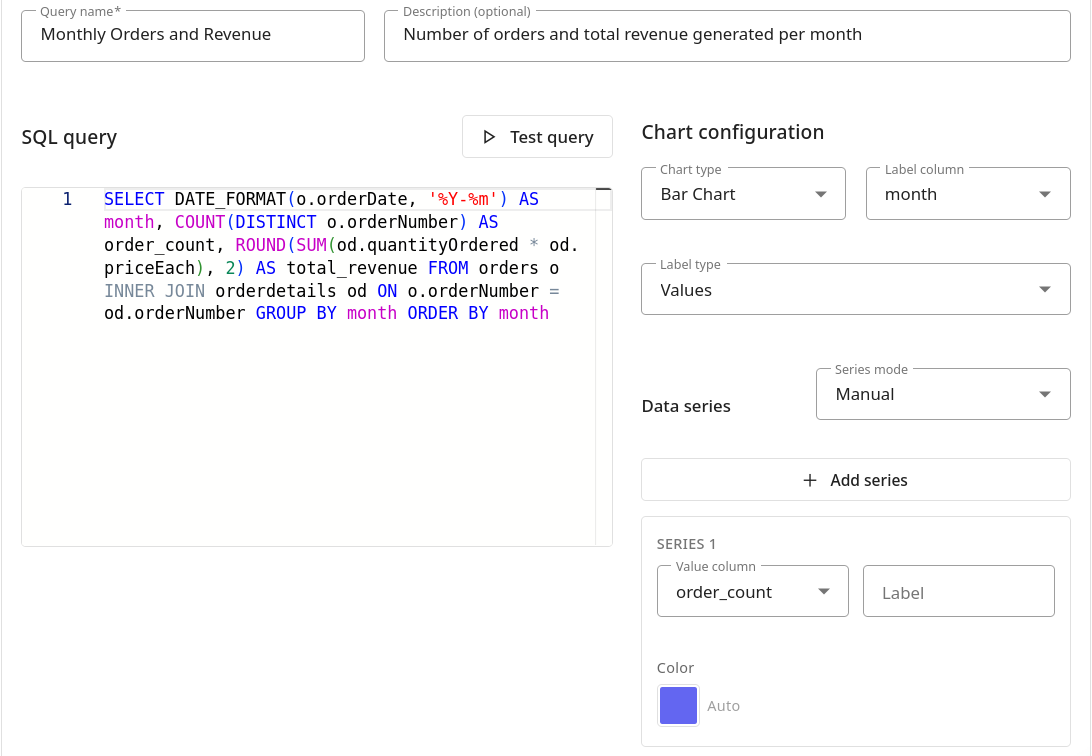
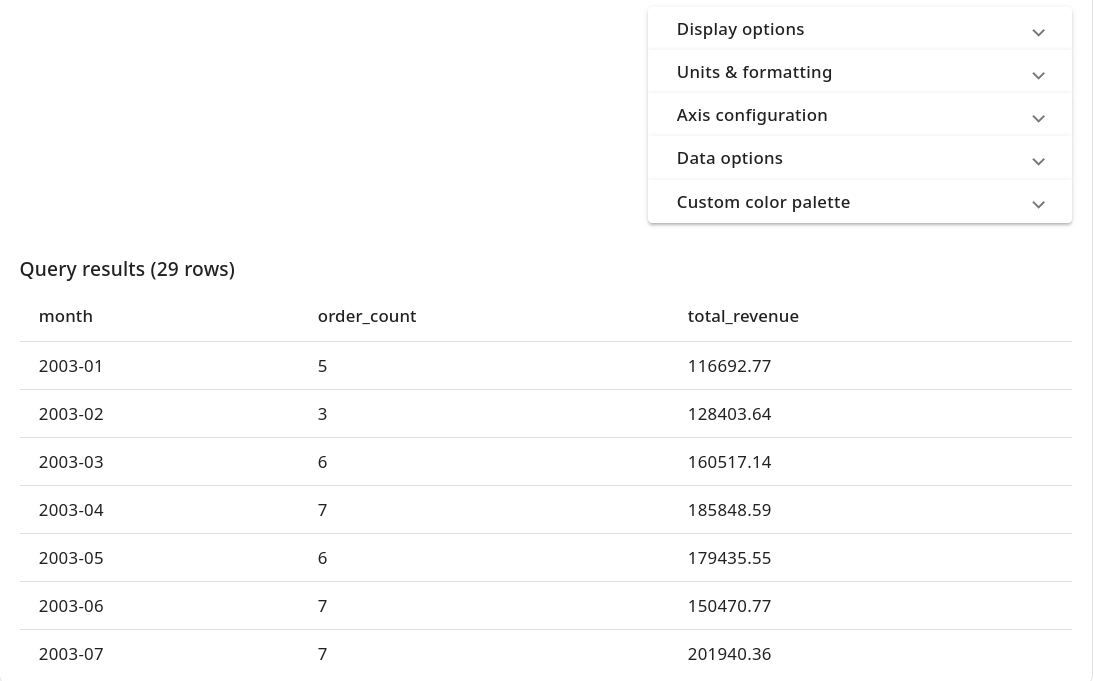
You can also review the SQL query that was generated by the AI assistant, the chart configuration, and the query results:
Manual configuration
Another way to create a panel is to manually configure it.
Steps to follow:
-
From the Dashboards -> Panels screen, click the Create Panel button:
-
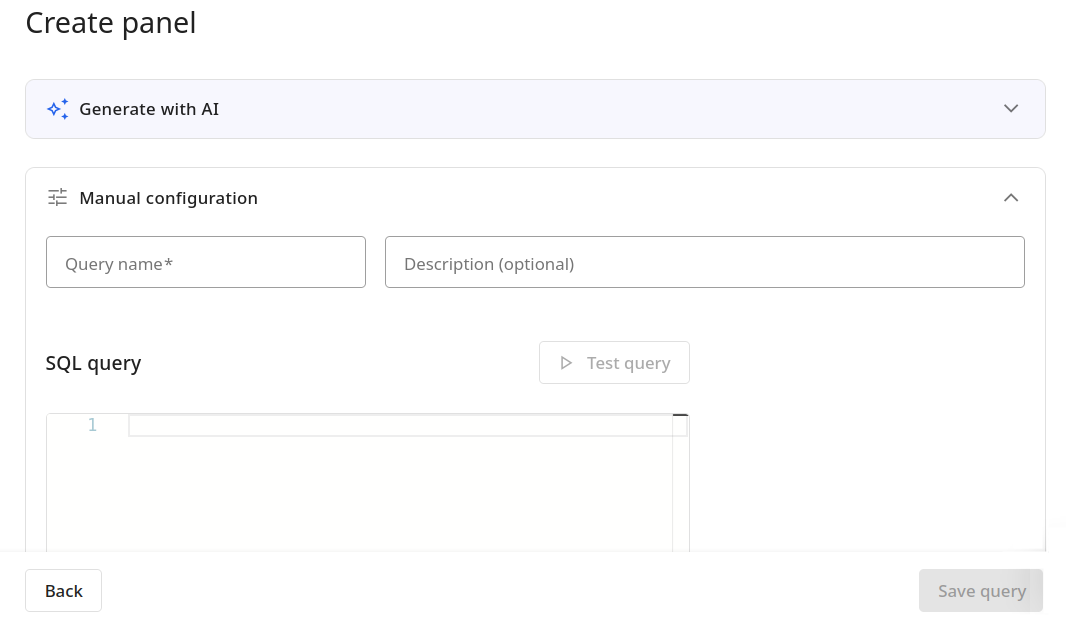
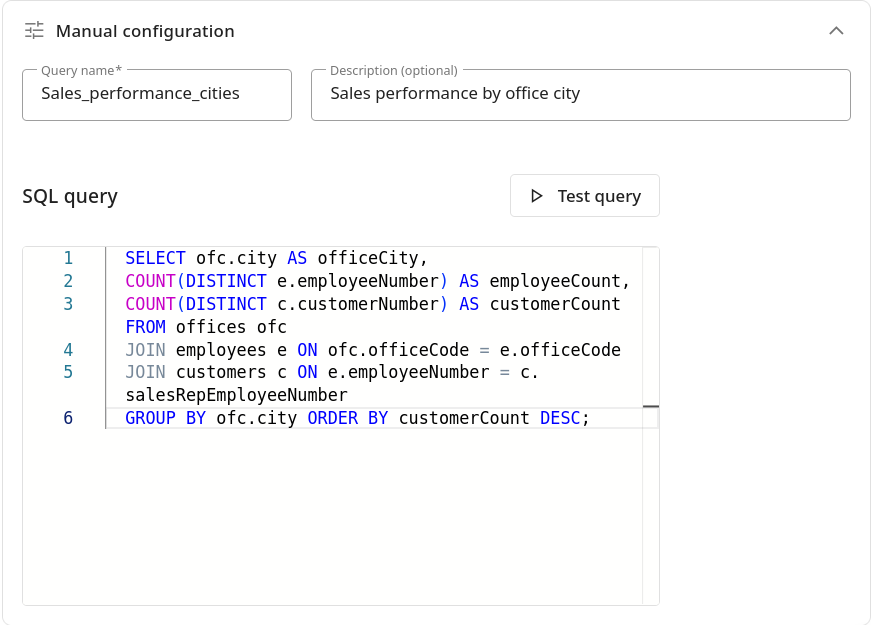
In the Create Panel screen, expand the Manual configuration options and provide the following details:
- Query name
- Description (optional)
- SQL query
SQL query example
You may want to illustrate with a chart how many of your sales representatives are working across various offices and the number of customers they manage.
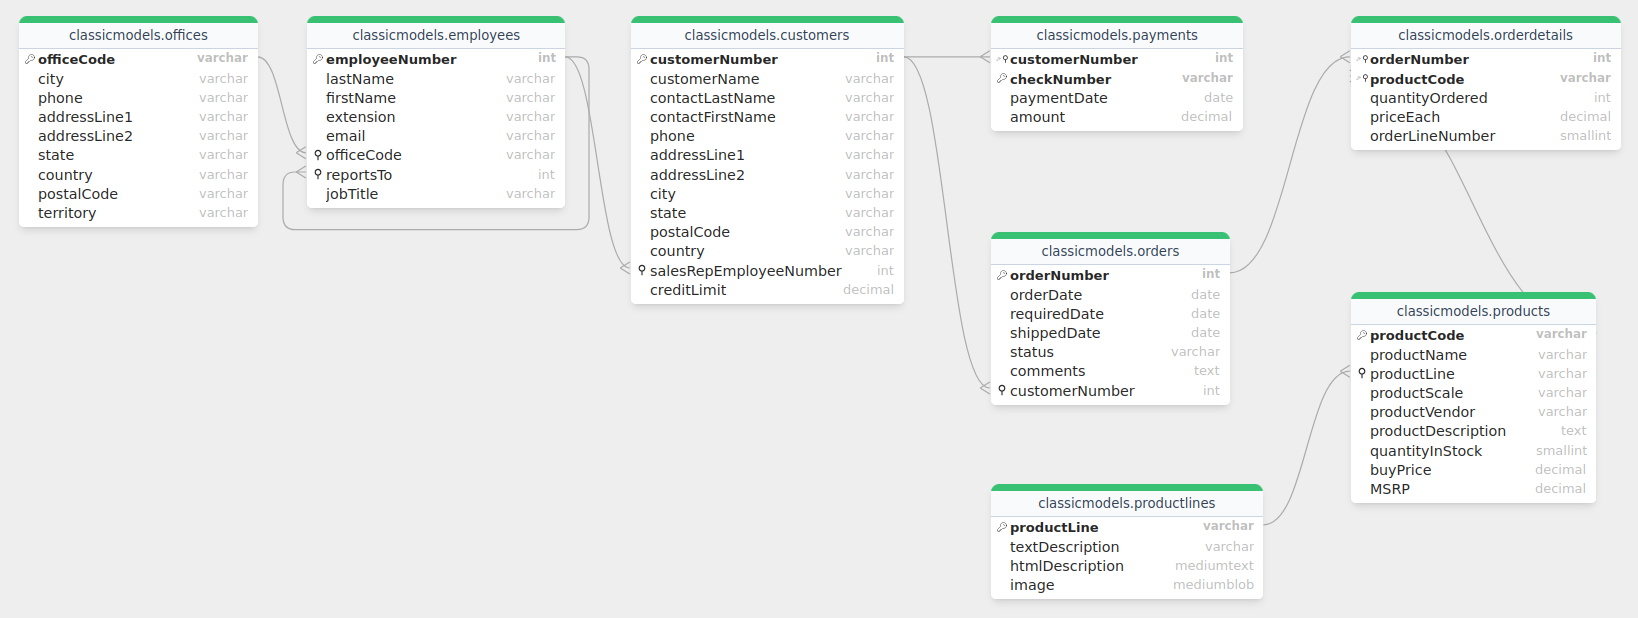
The following picture represents the ER diagram of the sample database we will use for demonstration:
The SQL query to display sales performance by office city will look as follows:
  SELECT ofc.city AS officeCity,
  COUNT(DISTINCT e.employeeNumber) AS employeeCount,
  COUNT(DISTINCT c.customerNumber) AS customerCount FROM offices ofc
  JOIN employees e ON ofc.officeCode = e.officeCode
  JOIN customers c ON e.employeeNumber = c.salesRepEmployeeNumber
  GROUP BY ofc.city ORDER BY customerCount DESC;
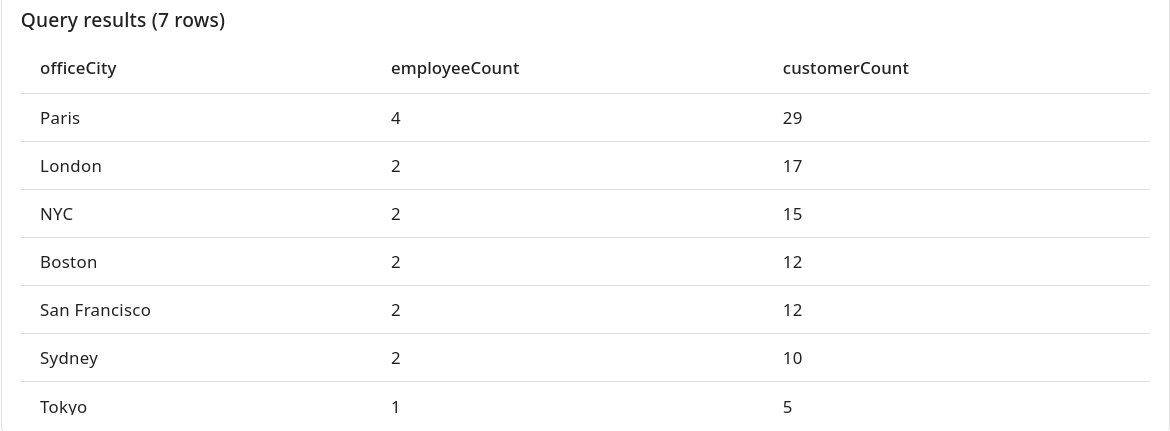
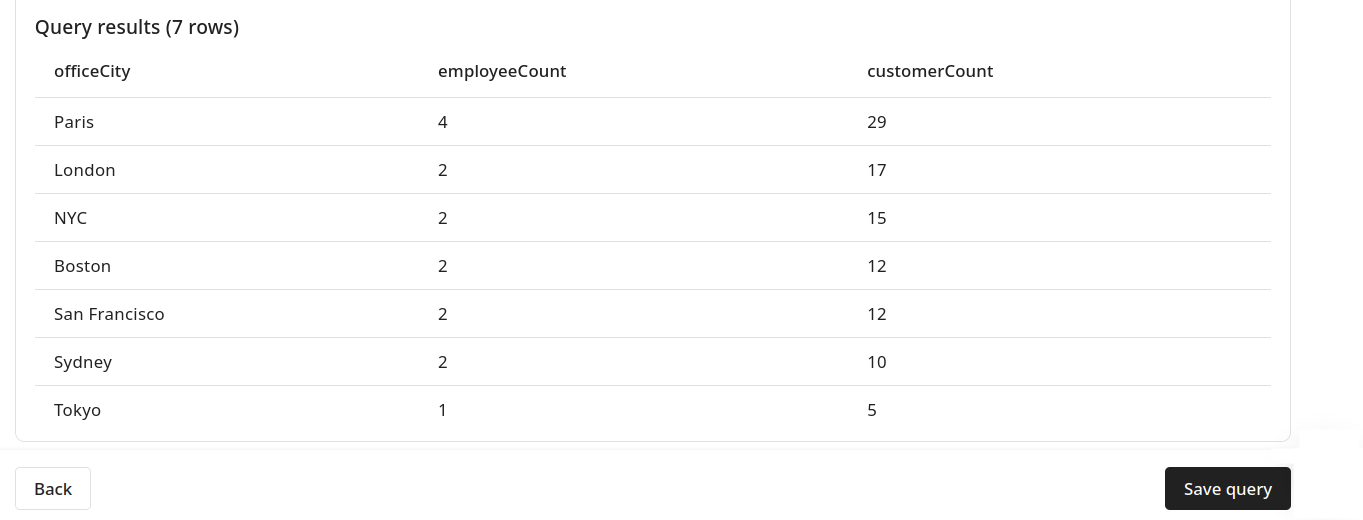
To execute the SQL statement, click the Test query button. The output will be displayed in the Query results section:
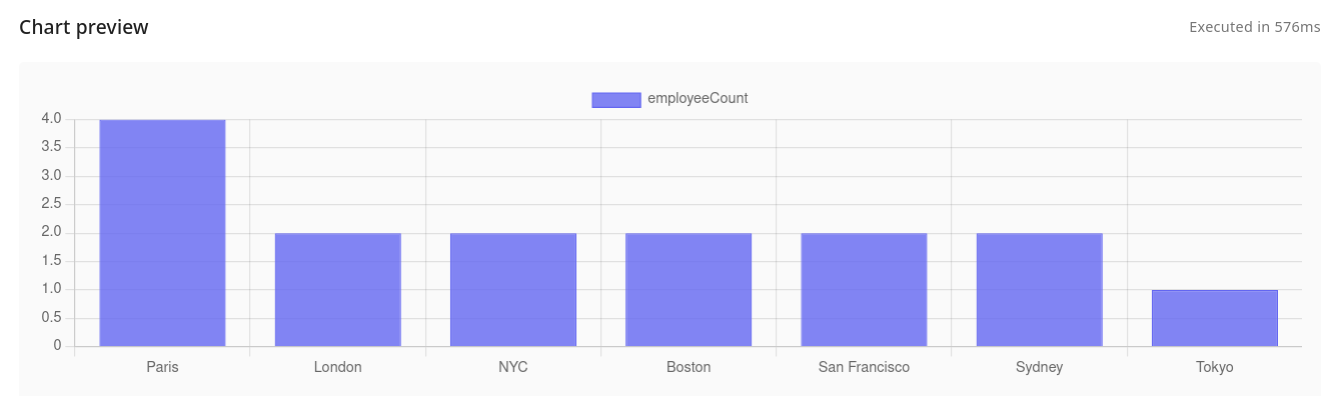
Please note that by default, the preview will only include the first data series:
To enhance the chart, you could explore more choices within the Chart configuration section.
Chart configuration
You can configure multiple data series, each with its own color, type, axis, fill, and point style. Data can be visualized as bar, line, pie, doughnut, or polar area charts. Charts also support stacking, horizontal orientation, data labels, custom color palettes, and unit/number formatting.
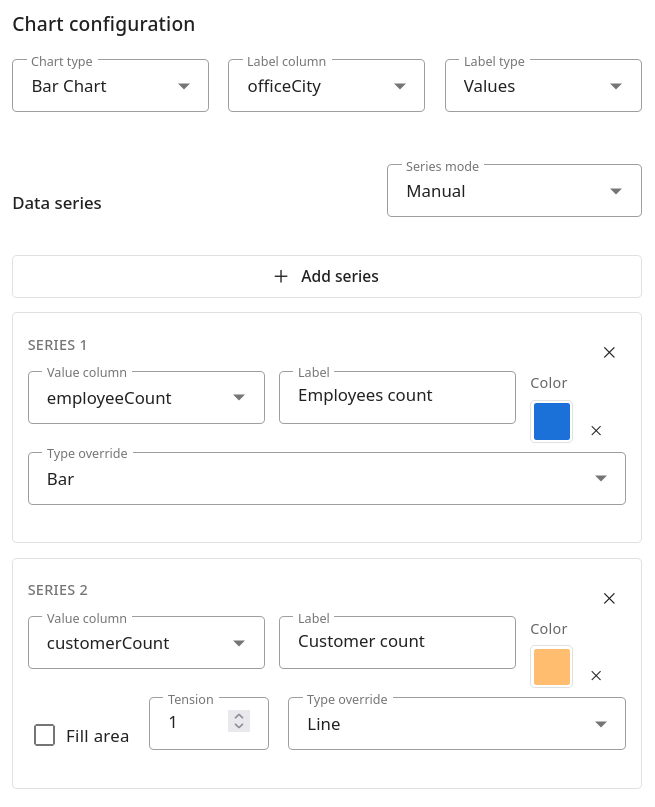
Using again the above example, you can add a second data series to the chart by clicking the Add series button:
-
Series 1 with Value column employeeCount and type Bar
-
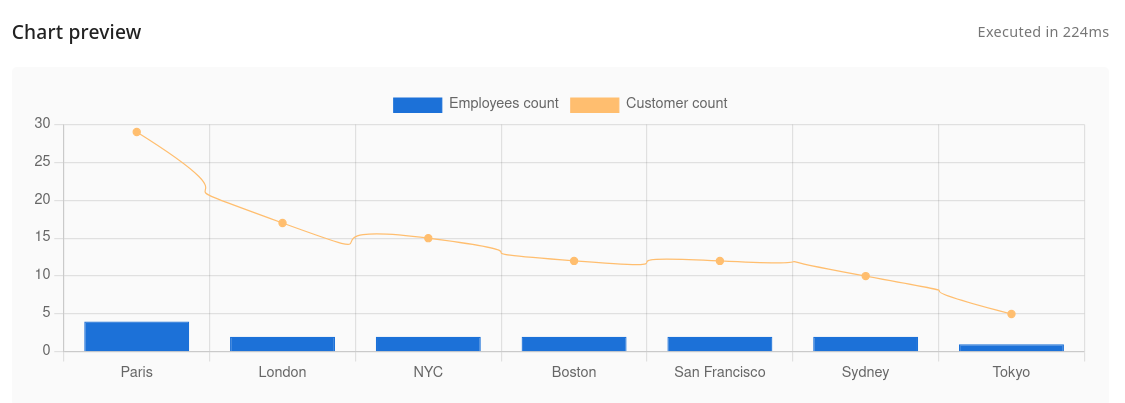
Series 2 with Value column customerCount and type Line
Then the improved chart will look as follows:
Saving a panel
To save your panel:
-
Navigate to the end of the panel's screen and click the Save query button:
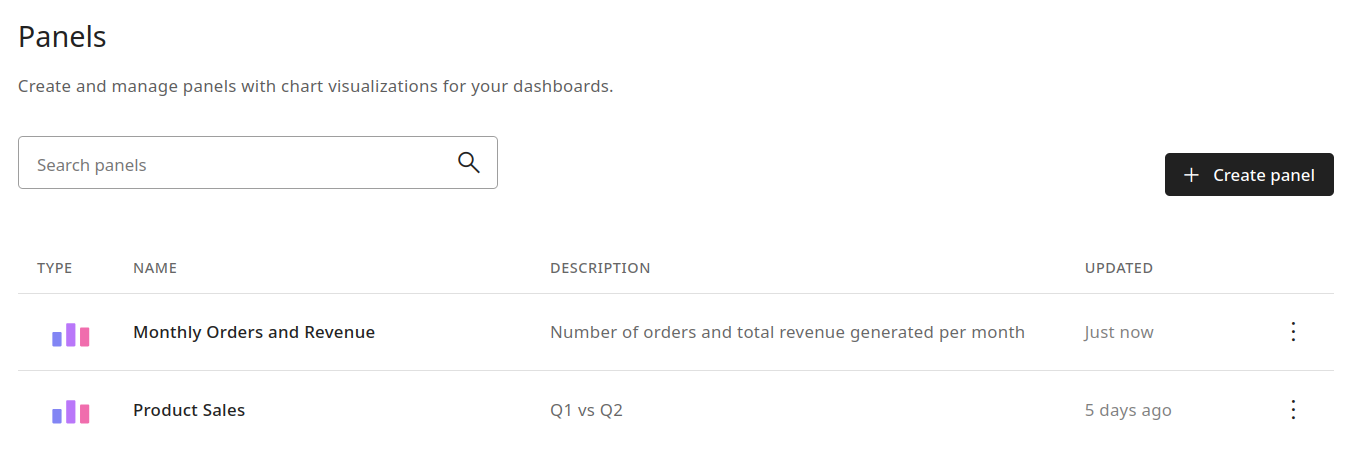
The panel will be saved and you will be redirected to the Panels main screen:
Editing a panel
There are two ways to open a panel for editing:
- from the Panels main screen, click the name of panel which you want to edit
or
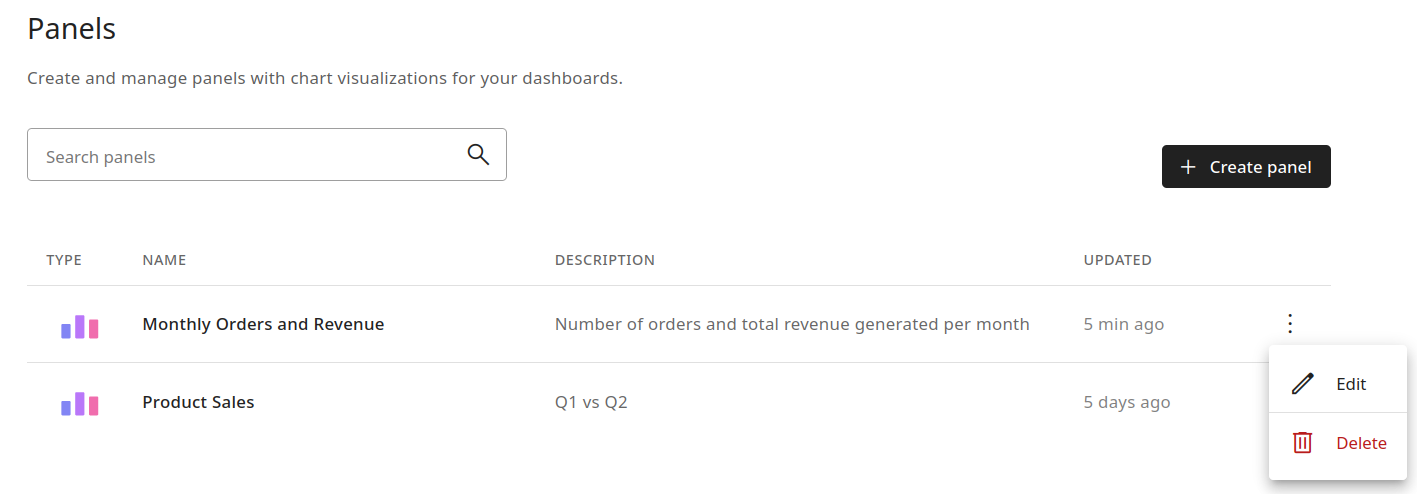
-
click the icon next to the panel which you want to edit and then select Edit
Deleting a panel
To delete a panel:
-
From the Panels main screen, click the icon next to the panel you want to delete:
-
Select Delete.
-
The Delete saved query dialog appears with the message: "Are you sure you want to delete the query <query-name>?"
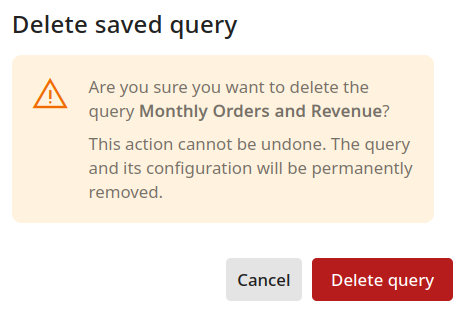
This action cannot be undone. The query and its configuration will be permanently removed.
- Click the Delete query button.
The panel will be deleted.